Lewis Reeves
ELEC 2120 Signals & Systems
10/8/2024
Lab 5: Matlab Plotting and Function Building
Introduction:
This lab covers how to create functions in MATLAB. The lab discusses using functions to plot step, ramp, and pulse functions. Students learn how to plot these functions using subplots and section breaks along with giving each plot a title and proper labeling. Students exercise their previous skills to plot these functions neatly and efficiently.
Procedure:
1) Write a MATLAB Function
1.1 Explain the t = and plot command lines.
- The t = command line outlines the range of variable t that is solved for and how often the graph plots a point. For example, t = -5:0.001:5 means that the plot graphs the solution of the function from t = -5 to t = 5 at every 0.001 increment. The plot command line tells MATLAB to plot an equation through a range. For example, plot(t,u(t,0)) says to plot the function u(1,0) along the defined variable t which was defined in the previous step.
1.2 Describe what happens when you change the step size of t from 0.001 to 0.1.
- When the step size is changed from 0.001 to 0.1, MATLAB plots the function at every 0.1 making the function less precise and giving the step a visible slope.
1.3 Explain what y = t >= to is telling MATLAB to do.
- The t >= to gives a binary output of 1 if t is greater than or equal to “to.” Otherwise, it gives an output of 0. This means that y = 1 when t is greater than or equal to “to” and y = 0 when t is less than “to.”
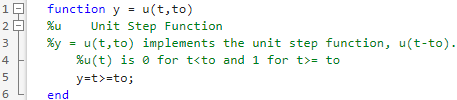
Figure 1 – Unit Step Function Code
2) Ramp Function
2.1 Explain what y = (t – to).*(t >= to) is telling MATLAB to do.
- The (t – to) subtracts “to” from t and multiplies (t >= to) by the result. As explained in (1.3), (t >= to) gives a binary result of 1 if t is greater than “to” or 0 if t is less than “to.” This means (y = t – to) while t is greater than or equal to “to” and (y = 0) while t is less than “to.”
2.2 Figures 3 and 4 show the ramp function working correctly with to = 1 in Figure 3 and to = 2 in Figure 4.

Figure 2 – Ramp Function Code
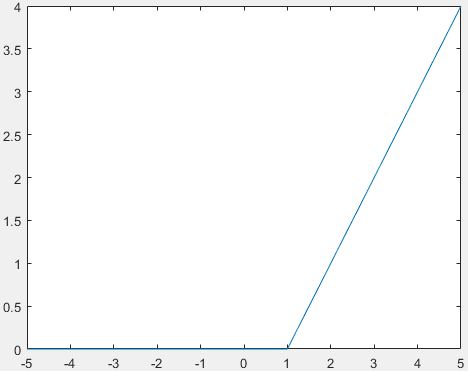
Figure 3 – Ramp Function Plot of to = 1
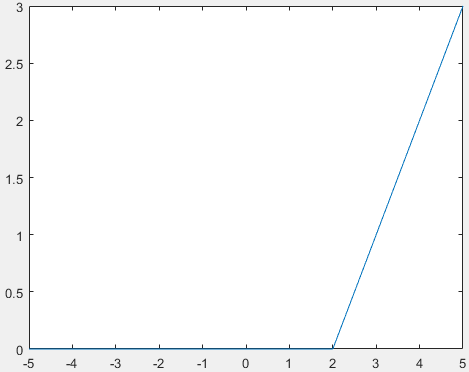
Figure 4 – Ramp Function Plot of to = 2
3) Plotting Skills
- The unit step function and ramp function are run with range -10 to 10 plotting at every 0.1 step. The figures are displayed using a subplot below, and they are identical to figure 2 in the instructions.
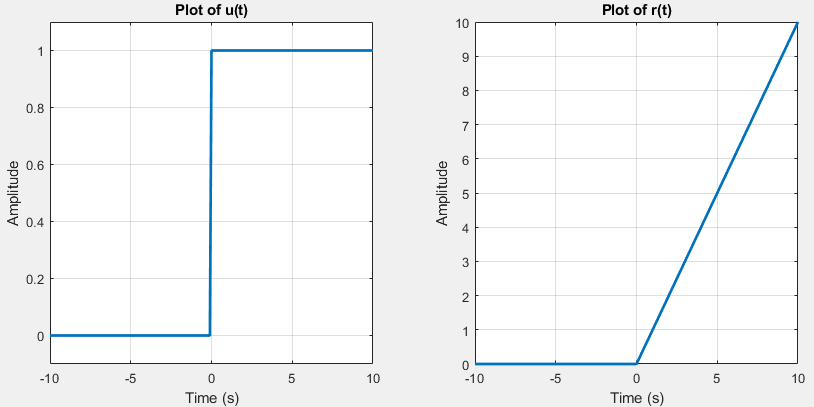
Figure 5 – Plot of u(t) and r(t)
4) Build the Pulse Function
- The pulse function is made so that it equals 1 between -tau/2 and +tau/2. Two example plots of the pulse function are displayed in Figures 6 and 7.
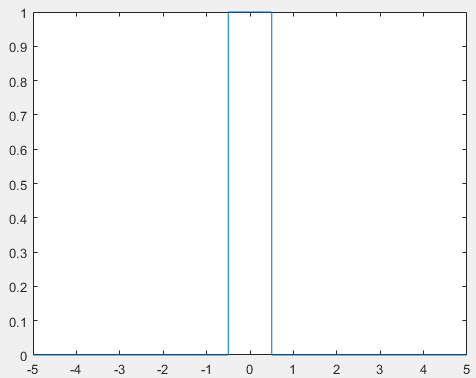
Figure 6 – Pulse Function Plot of Tau = 1
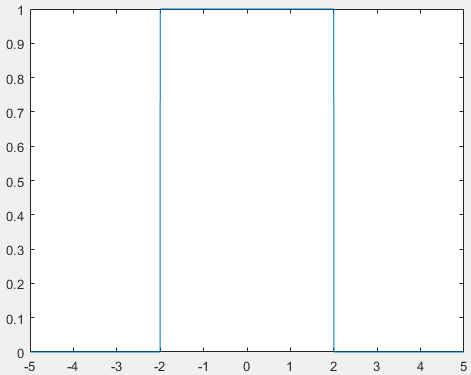
Figure 7 – Pulse Function Plot of Tau = 4
5) Generate a Script with Different Sections
5.1 What is the difference between using subplot for two plots and having two figures?
- The difference is a subplot plots the two plots as two separate figures, but having two figures can allow you to plot the two figures on the same plot.
5.2 The plots of the step, ramp, and pulse functions are shown in Figure 8. This figure reproduces figure 4from the instructions.

Figure 8 – Step, Ramp, and Pulse Plots
5.3 The plots of equations x1 and x2 are shown in Figure 9. The plots are combined into one figure with x2 being dotted to separate it from x1.
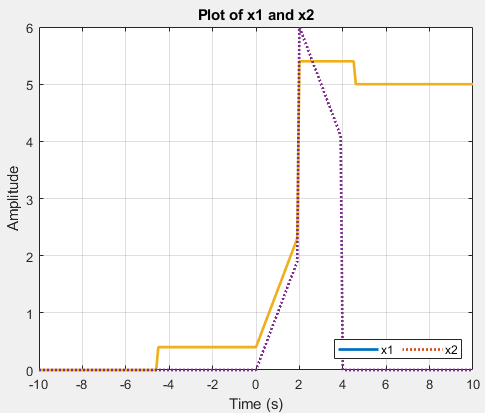
Figure 9 – Plots of x1 and x2 in One Figure
Conclusion:
The lab successfully introduces the concepts of functions in MATLAB. The lab covers how to plot functions in one figure along with plotting equations within a single plot.
This lab was very thorough in its coverage of plotting functions and equations using step, ramp, and pulse functions. The extend of the lab was very interesting seeing. It was enjoyable to see how much MATLAB can do with plotting functions and getting into tiny details. This lab was a bit difficult to follow because some instructions weren’t clear on whether or not to use the subplots, and it relied heavily on previous MATLAB knowledge without any refreshers. I would improve the experiment by starting off with a couple important MATLAB concepts from previous labs that will be helpful throughout this lab before getting into the new material.