Lewis Reeves
ELEC 2120 Signals & Systems
9/17/2024
Lab 4: Special Signals TIMS
Introduction:
This experiment goes over how a signal is affected by passing through a system, using step and pulse signal inputs, and constructing a digital detector. The experiment will introduce the audio oscillator, sequence generator, baseband channel filters, and utilities modules. The modules are used to display the effects of a signal passing through a system. They are also used for generating the step and pulse signals and constructing the digital detector.
Procedure:
A.1 The AUDIO OSCILLATOR
First, the audio oscillator is inserted into the TIMS. The audio oscillator TTL output is connected to the TTL input of the frequency counter. The TTL output is also connected to Channel A of the PicoScope. The value of the frequency counter is set to 1kHz by adjusting the f knob on the audio oscillator.
The PicoScope 6 software is opened, and the time scale is set to 200us/div. The trigger is set to single. The signal is run by pressing the green triangle play button. The signal is then inspected using the magnifying glass zoom tool in the PicoScope software. The pulse width and clock cycle are measured. The pulse width is found to be 481.7us while the clock cycle is 998.4us.
2. The SEQUENCE GENERATOR
The sequence generator is inserted into the TIMS. The audio oscillator TTL clock signal is connected to the red clock input of the sequence generator, the frequency counter, and Channel A of the PicoScope. The sequence generator’s red X output is connected to Channel B of the PicoScope.
On the PicoScope software, Channel B is turned to auto, the time bas is set to 1ms/div, and the triggering is set to single. The signal is run, and the signal is inspected using the magnifying glass zoom tool to find the shortest interval of the digital signal. The signal is displayed in Figure 1. The briefest interval of the digital (red) signal is found to be 1.98ms which is two clock (blue) cycles. The result is converted to binary, and the result is 1101000011.
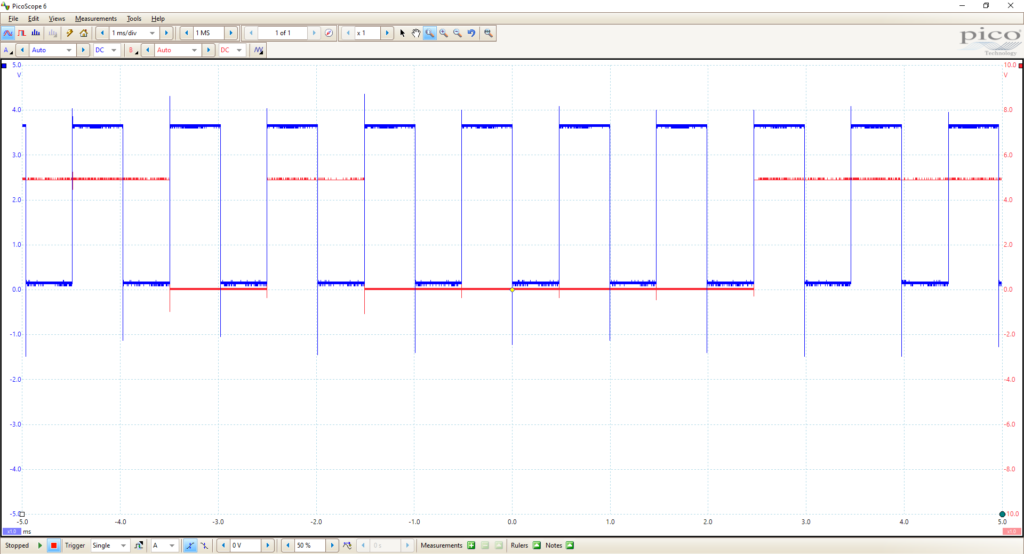
Figure 1 – Sequence Generator Clock and Digital Signal
3. BASEBAND CHANNEL FILTERS
The baseband channel filters module is inserted into the TIMS. The audio oscillator TTL clock signal is connected to the sequence generator’s red clock input and the frequency counter. The sequence generator’s TTL clock output is connected to the basebad channel filters input and Channel A of the PicoScope. The baseband channel filters OUT is connected to Channel B of the PicoScope. Channel two is selected on the baseband channel filters module.
The PicoScope software is set to a time scale of 1ms/div. The AC coupling is set on Channel A. Channel B is turned on with the scaling set to +/-5V. The signal is set to single triggering, and the signal is run several times to view the pattern of the signal. The delay, rise, and fall times are measured for baseband filters 2-4. The results are displayed in Table 1.
| BBLPF2 | BBLPF3 | BBLPF4 |
| 1kHz | 1kHz | 1kHz |
Delay | 245.5us | 249.7us | 846.9us |
Rise time | 209.6us | 287.9us | 167.6us |
Fall time | 200.0us | 292.4us | 174.9us |
Table 1 – Baseband Channel Filters 2-4 Delat, Rise, and Fall times
With the switch on the baseband channel filters set to channel four, the f knob is increased until the frequency counter reaches 2.0kHz. The output is observed, and the knob is turned up until the ones and zeros of the signal are no longer distinguishable. The signal is no longer distinguishable around 6kHz. The resulting signal is shown below in Figure 2.
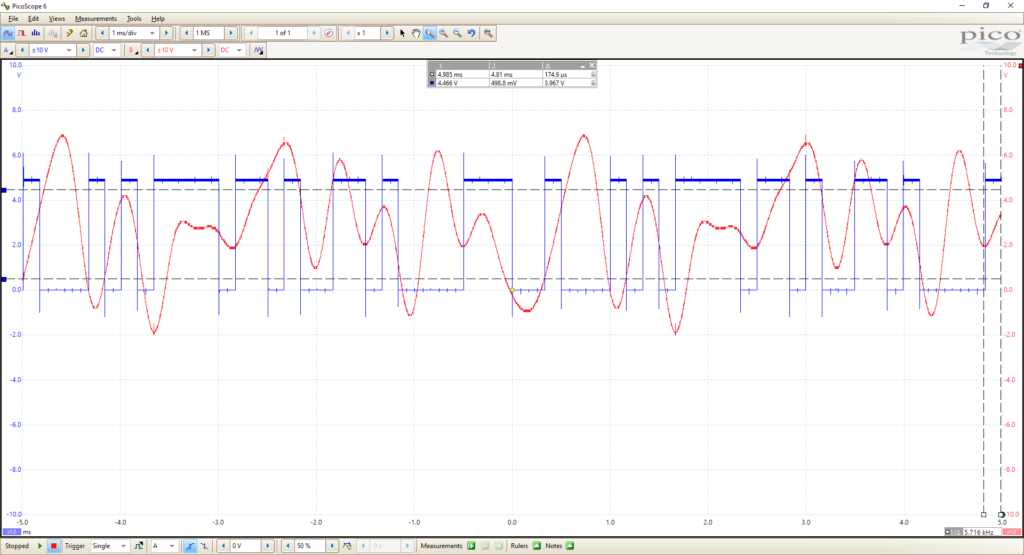
Figure 2 – Non-distinguishable Signal
B Step Input
The audio oscillator output is connected to the frequency counter input and the baseband channel filters input. Channel A of the PicoScope is connected to the baseband channel filters input, and Channel B is connected to the baseband channel filters output. The f knob is asjusted on the audio oscillator to the lowest setting, and the baseband channel filters is set to channel two. The time scale is set to 500us/div, and the output of Channel B is set to +/-5V DC coupling with the trigger set to single. The signal is run several times to see multiple views of the signal. The time delay and rise time are measured for each baseband channel filter 2-4, and the results are displayed in Table 2.
| BBLPF2 | BBLPF3 | BBLPF4 |
Delay time | 228.8us | 236.5us | 845.5us |
Rise time | 214.6us | 280.1us | 164.8us |
Table 2 – Baseband Channel Filters Step Input Delay and Rise Time
C. Impulse
The audio oscillator TTL LEVEL OUTPUT is connected to the sequence generator’s TTL CLOCK input and to the frequency counter’s TTL input. The sequence generator’s SYNC output is connected to the PicoScope Channel A. The audio oscillator knob is turned to the lowest setting.
In the PicoScope software, Channel A is set to DC coupling with the trigger switched to auto. The signal is inspected for all the values displayed in the table below. The relationship is graphed in Figure 3.
Cycles per second | Pulse Width |
500 | 1.993ms |
1000 | 995.6us |
1500 | 663.9us |
2000 | 498.2us |
3000 | 330.2us |
4000 | 249.4us |
6000 | 164.4us |
8000 | 125.0us |
10000 | 93.89us |
Table 3 – Relationship Between Frequency and Pulse Width
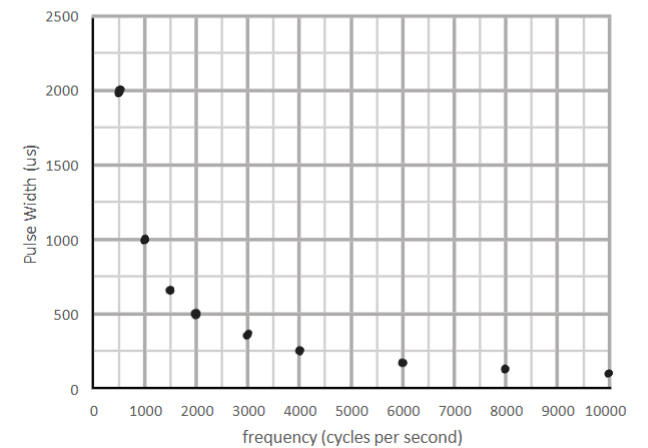
Figure 3 – Table 3 Graph
Next, the sequence generator SYNC output is connected to the baseband channel filters input, and the baseband channel filters output is connected to Channel B of the PicoScope.
On the PicoScope software, Channel B is turned on with DC coupling set and +/-10V. The audio oscillator f knob is set to 300Hz. The response of the system is observed as the frequency is turned up to 1000Hz. The higher the frequency, the smaller the flat top of the response becomes until it is no longer flat. The frequency is raised to 2000Hz, and the response gets smaller. Finally, the frequency is raised to 10,000Hz, and the signal starts to disappear. The amplitude changes because the signal has less time to increase as the pulse width decreases.
D.1
The audio oscillator sin(omega*t) output is connected to the buffer amplifier input A. The bugger amplifier output k1A is connected to the frequency counter, the baseband channel filters input, and Channel A of the PicoScope. The audio oscillator is adjusted to 300Hz, and the baseband channel filters is set to channel two. The baseband channel filters output is connected to Channel B of the PicoScope.
In the PicoScope software, the timescale is set to 1ms/div and the trigger set to auto. Channel B is turned on with auto scale and adjusted as needed. The buffer amplifier gain is adjusted to reach 6Vpp in the input. the output signal Vpp is recorded and Table 4 is filled out for each frequency measurement. As the frequency is raised, the response becomes fuzzier.
Frequency Hz | BBLPF2 | BBLPF3 | BBLPF4 |
300 | 6.478V | 6.318V | 6.532V |
1000 | 7.006V | 5.361V | 8.199V |
2000 | 5.253V | 2.242V | 6.666V |
3000 | 479.7mV | 410.0mV | 635.7mV |
4000 | 69.29mV | 70.19mV | 74.48mV |
5000 | 14.6mV | 16.16mV | 37.6mV |
Table 4 – Vpp Versus Frequency Relationship for a Basic Sine Wave Function
2.
Now, the audio oscillator sin(omega*t) output is connected to the buffer amplifier input. The buffer amplifier analog output is connected to the frequency counter, the utilities analog signal input, and Channel A on the PicoScope. The Clipper is connected to Channel B of the PicoScope.
In the PicoScope software, Channel B is turned on and set to the same scale as Channel A. The buffer amplifier k1 is decreased to a Vpp of 300-350mV. The signal is run with a single trigger. The signal loses its flat top and becomes more like a basic sine wave. As the signal amplitude is slowly increased to 20Vpp, the signal becomes flatter and flatter.
E.
Finally, the audio oscillator sin(omega*t) output is connected to the input of the sequence generator and the frequency counter. The sequence generator audio output is conneted to the baseband channels filter input and Channel A on the PicoScope. The baseband channels filter output is connected to the utilities module analog signal input and Channel B of the PicoScope.
In the PicoScope software, the timescale is set to 2ms/div, Channel B is turned on to auto, and triggering is set to single. The output is observed, and then Channel B is disconnected and connected to the utilities clipper. The input digital signal is observed as frequency is increased. The signal appears to be delayed and inverted in the output.
F (kHz) | Input digital signal | Output digital signal |
4 | 11110001 | 00001110 |
5 | 10110010 | 01001101 |
7 | 10111100 | 11000011 |
Table 5 – Input Digital Signal Versus Output Digital Signal for the Digital Detector
Conclusions:
This lab achieved its goals of demonstrating how a signal is affected by passing through a system, using step and pulse signal inputs, and constructing a digital detector. I found this lab very interesting in getting to compare all the different signal generations and how frequency alters the signals. The lab took a long time because there is so much that has to be done, and I got some of my wires mixed up in a few sets. I would improve the lab by adding as many graphs as would be helpful. If there were one or two more graphs in each section, it would be easier to follow.